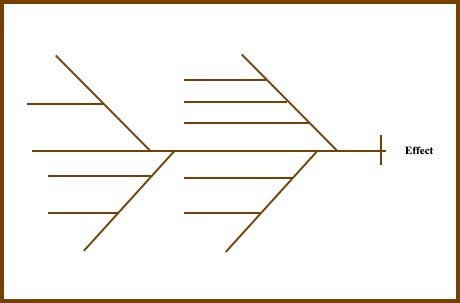
In the context of the PMP exam, a Cause-and-Effect Diagram, also known as an Ishikawa Diagram (named after its founder Kaoru Ishikawa) or Fishbone Diagram, is an analysis technique used to identify and trace the root causes of an undesirable effect or problem. This tool is one of the seven basic quality tools commonly referenced in project management. The diagram resembles the skeleton of a fish, hence its popular name, “Fishbone Diagram.”
For the PMP exam, the Cause and Effect Diagram can be defined as:
A Demonstration technique that helps trace an undesirable effect back to the root cause.
We require tools to effectively prevent and resolve problems. The primary focus should be on identifying and addressing the root causes of issues, thereby ensuring that problems are avoided altogether (prevention) or do not resurface (corrective action). So, the Cause-and-Effect diagram is a valuable tool that enables team members to systematically trace the root causes of an effect or problem. It is commonly used in conjunction with the 5 Whys approach to problem-solving, where team members iteratively brainstorm and analyze the cause-and-effect relationships. This combination of techniques enhances the team’s ability to identify and address the underlying causes of issues.
In addition to the cause and effect diagram, there are several other essential quality tools that project managers can explore. For further information and insights on these tools, you can refer to the following series of blog posts:
These resources will provide detailed insights into each tool, its purpose, and how they can be effectively utilized in project management.
The process to develop a Cause-and-Effect Diagram:: Here, my emphasis is just to focus on the steps of development of the cause-and-effect diagram; a specific example will be added later
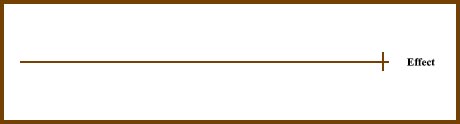
1. Identify the Effect: Clearly define the problem or the effect that you want to investigate and display it as the “head” of the diagram. This problem statement should be concise and accurately describe the effect you’re trying to address.
2. Assemble a Team: Gather a group of selected team members and stakeholders, preferably subject matter experts (SMEs), with relevant knowledge and expertise related to the problem. These individuals will contribute to the brainstorming process and help identify the causes for the effect.
3. Create Categories: Begin the brainstorming session by presenting the effect or problem statement to the team. Encourage the team members to think broadly and identify the major categories or factors that could potentially contribute to the problem. These categories are often referred to as the “bones” of the fishbone diagram.
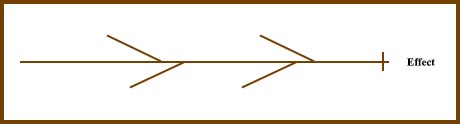
4. Brainstorm Causes and Explore Sub Categories: Under each category, facilitate a brainstorming session where the team members identify potential causes or factors contributing to the Effect. Encourage open discussion and capture all ideas without judgment or evaluation at this stage. You can use 5 why analysis during facilitation, where you encourage discussion to explore “Why” the Effect (cause of effect) and then further “Why” for broader categories and sub-categories. Further subcategories are identified for the broad categories of causes:
This process is repeated until we get the root cause of the problem.
Normally identification of branches for the main arrow of the diagram involves a process of using 5 Why. Number 5 is empirical, meaning five iterations of asking why are generally sufficient to get the root cause. However, questioning could be taken further to 6, 7, or higher in case more iterations are needed as per the nature of the problem.
Example Root Cause Analysis:
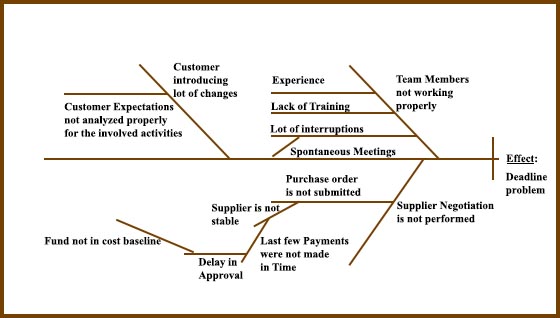
For example, if the effect identified is that we are unable to meet the deadline due to incomplete activities, following the aforementioned process allows us to create the following cause and effect diagram:
After analyzing this diagram, we can identify the following root causes that need to be addressed:
By addressing these root causes, we can work towards mitigating the issues that are preventing the completion of activities and ultimately improve our ability to meet the project deadline.
Use of Cause-and-Effect Diagram for the PMP Exam:
The Cause-and-Effect diagram is an essential tool among the 7 basic quality tools, and it finds application in both the planning quality and controlling quality processes as a Tool & Technique. In the context of these processes, its purpose is to facilitate identifying and analysing the cause-effect relationships.
2. In Quality Control: The primary objective of controlling quality is to assess the correctness of deliverables and work products by comparing them to the specified requirements. This process plays a crucial role in identifying the causes of poor process or product quality and providing recommendations for their resolution. The Cause and Effect diagram is an important tool utilized in this context to explore and analyze these recommendations thoroughly. By visually mapping out the cause-effect relationships, the diagram assists in identifying the underlying factors contributing to quality issues and guides the development of effective corrective actions. For example, if there is a significant increase in customer complaints, the diagram can help identify causes such as inadequate testing or communication gaps, enabling the team to implement targeted improvements and resolve quality issues effectively.
Here we can see that the Cause-and-Effect diagram can be implied both in the preventive approach when used as a tool in Plan Quality and the corrective action approach when used as a tool in Control Quality. In the Planning Quality process, it helps identify potential causes and effects, and when we are in monitoring, these serve as what deviation we need to remove from the work products and processes.
3. Root Cause Analysis using Cause and Effect Diagram in Agile for Continuous Improvement: The Cause-and-Effect diagram can be effectively applied in Agile approaches, such as when a team is experiencing frequent delays in delivering user stories. This tool allows the Agile team to visually map out potential causes, such as unclear user story requirements, dependencies on external teams, insufficient test automation, or inadequate team collaboration. This visualization enables the team to understand the root causes and their impact on project outcomes, fostering continuous improvement. Through collaborative exploration and prioritization of improvement opportunities, the team can proactively address the identified causes, resulting in enhanced efficiency and productivity within Agile projects.
Benefits of Root Cause Analysis using Cause and Effect Diagram:
So, there are several benefits associated with conducting a Root Cause Analysis using the Cause-and-Effect diagram. This approach helps us avoid making surface assumptions about problems and prevents us from providing generic answers, such as insufficient time or funding constraints. By using this analytical tool, we can identify and resolve problems to prevent their recurrence. For instance, if we discover that the non-submission of a purchase order caused a delay in receiving a necessary tool from a supplier, we can address the issue by issuing the purchase order. In the future, this problem can be prevented from resurfacing by ensuring that such costs are included in the project’s cost baseline.
Moreover, the Cause-and-Effect diagram contributes to improved communication within the team. Visualizing the relationships between causes and effects makes it easier for team members to understand the underlying factors contributing to a problem, facilitating effective communication and collaboration.
Another advantage of utilizing the Cause-and-Effect diagram is its ability to prevent problems altogether. The emphasis on building quality throughout the process rather than relying solely on inspection helps in proactively identifying and addressing potential issues, reducing the likelihood of problems arising in the first place.
By now, you have likely recognized the significance of a cause-and-effect diagram in identifying the root cause of problems or issues that impact a project. If you have any additional questions or require further clarification, please feel free to comment below in the designated comment box.
If you have aspirations to pursue the PMP certification, enroll with us for comprehensive support in your PMP certification journey. We offer expert guidance in exam preparation, assistance with the application process, and help in scheduling the exam. With our assistance, you can confidently navigate the certification process and increase your chances of success.
iZenBridge offers a wide range of comprehensive FREE resources to support you throughout your PMP certification journey. Explore our PMP Free Practice test, which provides a realistic simulation of the actual exam and helps you assess your preparedness with up-to-date questions. Our 50 Agile PMP Questions tutorial also delves deep into essential PMP Agile concepts, such as working with Requirements, value delivery, Agile Metrics, incremental delivery, and feedback. These tutorials provide detailed explanations and expose you to common Agile-related PMP exam questions. Whether you’re new to Agile or seeking to strengthen your understanding, our scenario-based PMP Agile questions are valuable tools for effective concept comprehension.

Histogram As A Component Of Seven Basic Quality Tools In the Project Management Professional (PMP) ...

A Check Sheet is one of the 7 basic quality tools relevant to the Project ...
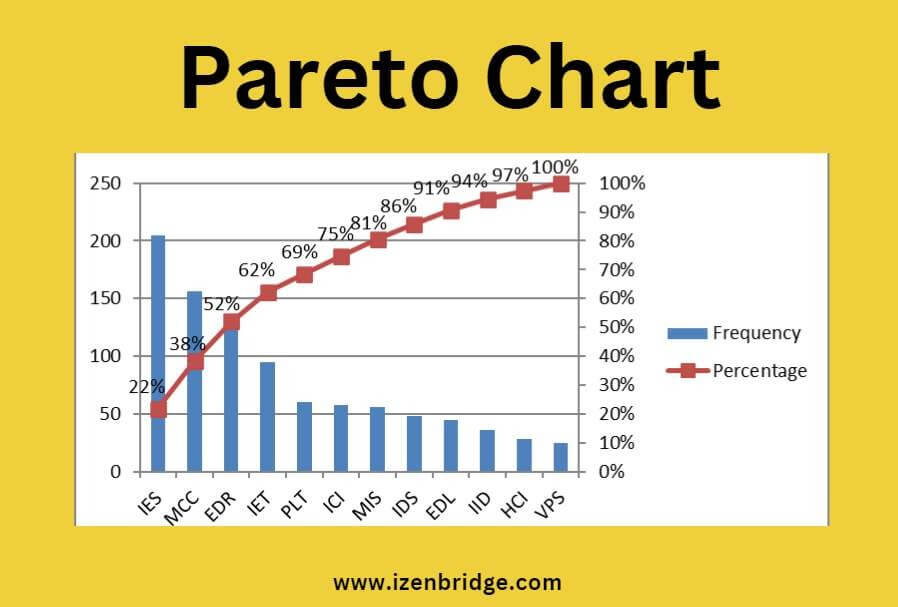
The Pareto Chart is a valuable technique in the PMP exam for identifying the most ...
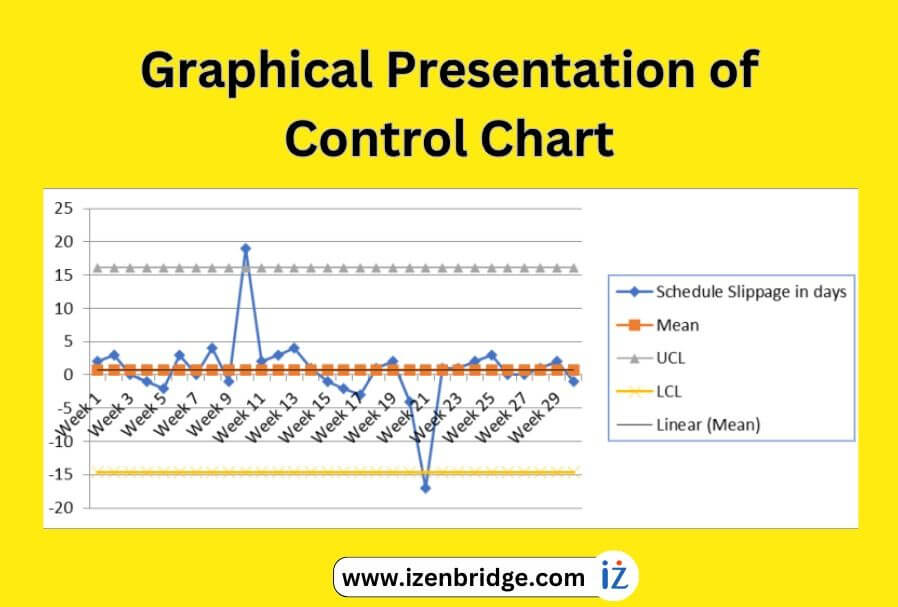
A control chart, a valuable quality tool in the PMP exam, helps us gain insights ...
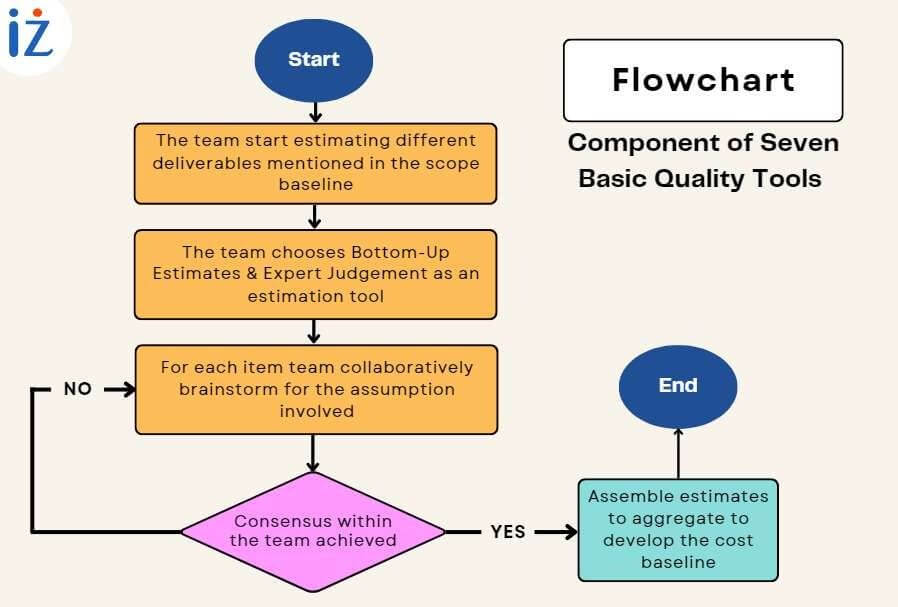
A flowchart, one of the seven basic quality tools, is defined as a graphical presentation ...
A scatter diagram in the PMP exam is a quality tool that aids project managers ...