Created Vs Resolved Issue Report in Jira: A Detailed Analysis
Industry Rediness Program
Created on :
September 8, 2023
Saket Bansal
Updated on :
September 8, 2023
0 Comments
A pertinent component in any software or project management process is the ability to track and analyze work items. The Created versus Resolved Issue Report in Jira is one such insightful tool that can assist teams in comprehending their backlog trends and planning effectively.
Purpose of the Created vs. Resolved Issue Report
Backlog Trend Analysis: This report is instrumental in visualizing how the backlog accumulates over time.
Demand vs. Capacity Planning: Teams can assess whether they are receiving more work than they can manage and identify potential bottlenecks.
How to Use the Report
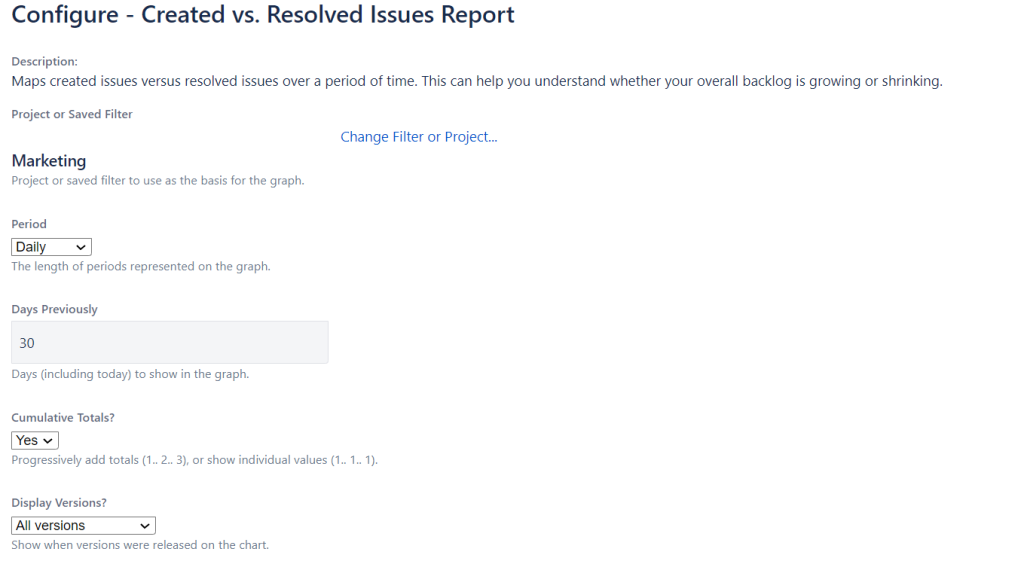
Filter Selection: To initiate the report, one must choose an appropriate filter, preferably focusing on a specific project. The correct filter is vital as an inaccurate or overly broad one can lead to confusing data.
Timeframe Analysis: Depending on the depth of analysis required, the report can be set to daily, weekly, monthly, or even quarterly periods.
Data Plotting: Users have the flexibility to select the amount of data they wish to analyze. For instance, a 90-day trend might benefit from weekly plotting, whereas a shorter span, like 30 days, may require daily plotting for granularity.
Cumulative vs. Discrete: Decide if you want a cumulative view or a daily view of created vs. resolved issues.
Interpreting the Report
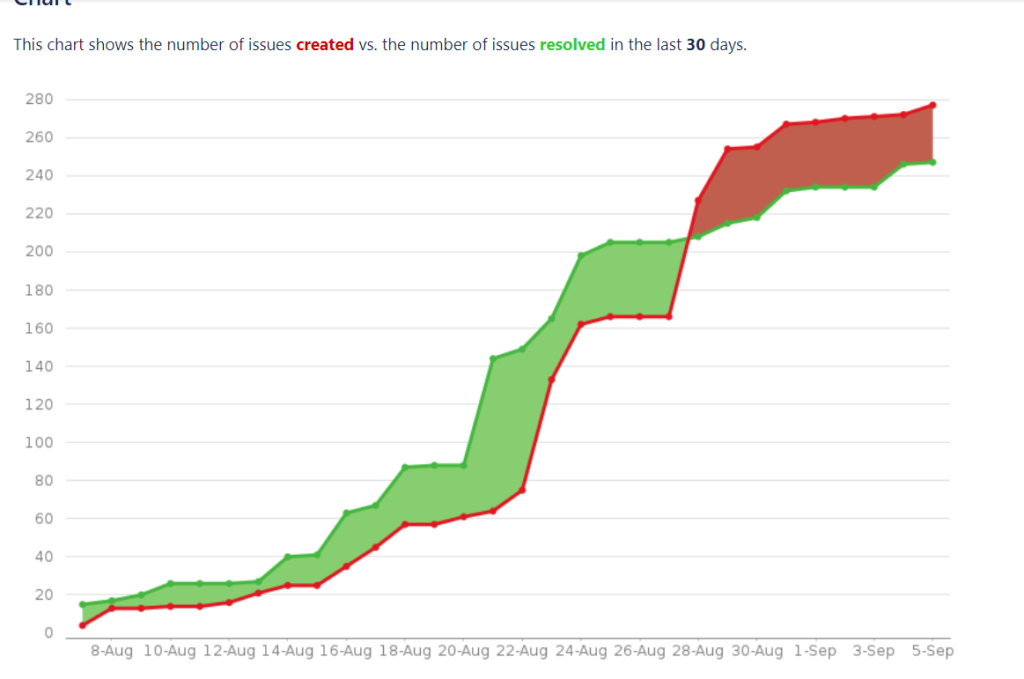
Color Codes: The report usually employs different colors or shades to distinguish between the number of issues created and those resolved.
Trend Analysis: By observing the color patterns, one can derive meaningful insights into issue creation and resolution trends. For instance, if the created issues’ line (often in red) surpasses the resolved line, it indicates more issues were raised than addressed during that period.
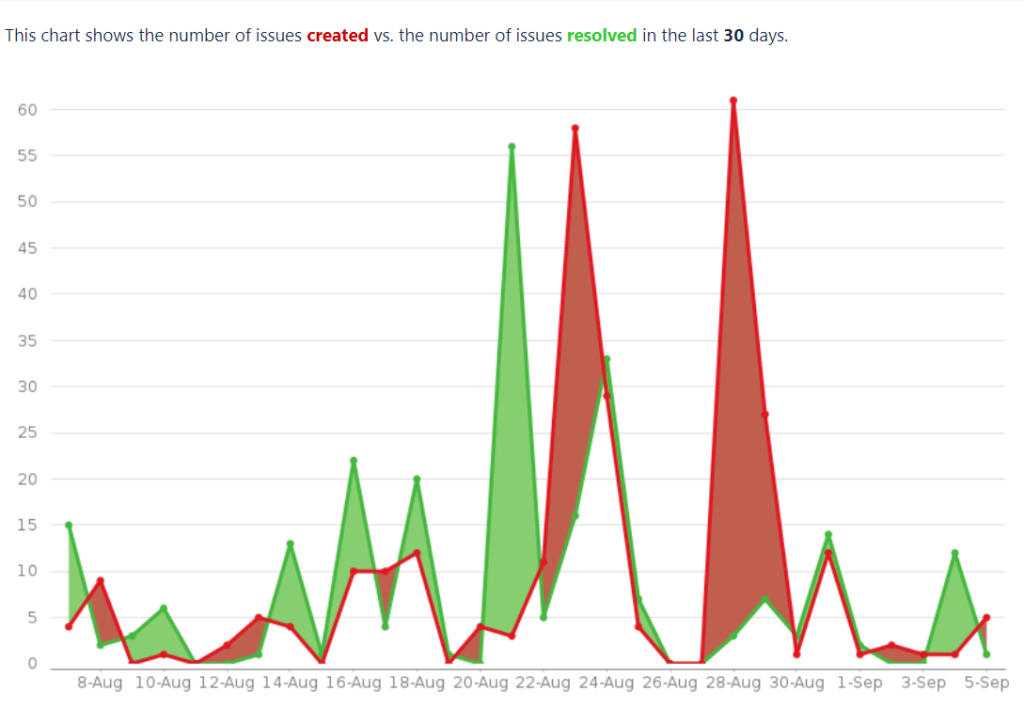
Specific Data Points: Delving deeper, users can hover over specific data points to view precise statistics for a given day. This granularity can provide context on unusual spikes or dips in the graph.
Comparative Analysis: The report can display a holistic view of a long duration using the cumulative setting or focus on short-term patterns by observing day-to-day changes.
Cumulative Analysis
Discrete View
Applications of the Report
Capacity Planning: By comparing created and resolved issues, teams can gauge their performance and plan future sprints or releases accordingly.
Predicting Future Commitments: A consistent pattern in the report might allow teams to make educated commitments in the future, based on their proven capacity.
Root Cause Analysis: In cases where unusual spikes or patterns emerge, teams can delve deeper into specific issues, aiding in identifying root causes and implementing corrective actions.
Ensuring Continuous Workflow: While resolving issues is vital, it’s equally crucial to ensure a steady flow of tasks. A decreasing trend in created tasks might signal an upcoming idle period for the team, requiring upstream interventions.
Conclusion
The Created versus Resolved Issue Report is more than just a graphical representation of data. It’s a strategic tool that, when used effectively, can enhance a team’s efficiency, predictability, and overall project management prowess. Every project manager, scrum master, or team lead should familiarize themselves with this report, ensuring they harness its full potential in steering their team towards success. If you need help optimizing your Jira implementation, explore our Jira Optimization services.