Control Charts in Jira: A Tool for Effective Work Management
Industry Rediness Program
Created on :
August 16, 2023
Saket Bansal
Updated on :
August 24, 2023
0 Comments
Project management is a field rife with tools, methodologies, and practices. One such invaluable tool, especially when operating in Kanban using Jira, is the Jira control chart. In this blog, we’ll dive deep into Jira control charts, demystifying their components and showing you how to leverage them effectively.
The Basics of Jira Control Charts
At its core, a control chart is a visual representation showcasing process variations over time. In Jira, this graphical tool is instrumental in:
Predicting cycle and lead times.
Spotting trends.
Facilitating retrospectives.
Problem-solving analysis.
With the Y-Axis denoting the cycle time and the X-Axis representing the time duration (e.g., 7 days, with each day being plotted), it gives a clear view of how tasks progress with time.
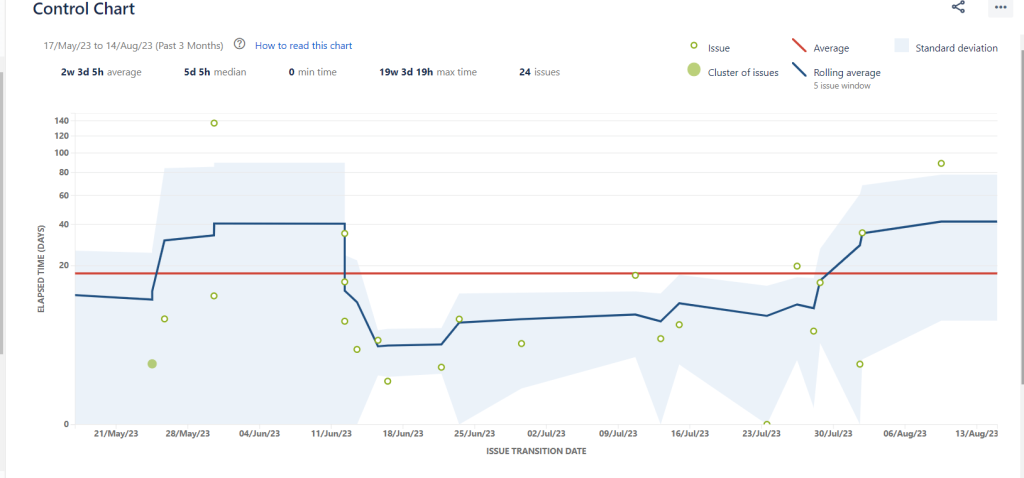
Control Chart
Decoding the Key Components
Cycle Time: This refers to the duration a task remains in a particular stage or column on your Kanban board. So, if you’ve ever wondered how long a task stays in the ‘Development’ stage, for instance, you’re essentially referring to its cycle time. Notably, if a task re-enters a stage, the time taken during this stage gets added to the cycle time.
Lead Time: The cumulative time from when a task is introduced to the backlog until its completion. By selecting all stages or columns in the Jira Control chart, one can extract the lead time.
Rolling Average: A moving line that captures the average cycle time for a set number of issues. This line, often in blue, is calculated based on the issue in question, N issues before, and N issues after it. It’s instrumental in tracking the trend of cycle time over durations.
Standard Deviation: Visualized as a blue shaded region, this captures the variation of real data from the rolling average. It serves as a reliable predictor of cycle time.
Dots: Each dot embodies either an issue or a cluster of them. Their placement on the Y-Axis denotes the cycle time, while their position on the X-Axis indicates the transition date out of the last status.
Unpacking the Control Chart
Exploring Data: Upon clicking, Jira extracts pertinent data, illustrating the average line, rolling average, and standard deviation. Knowing these elements is essential for effective chart interpretation.
Handling Outliers: Outliers stand out as tasks diverging significantly from the average. Recognizing why these occur is pivotal for pinpointing inefficiencies or remarkable performances.
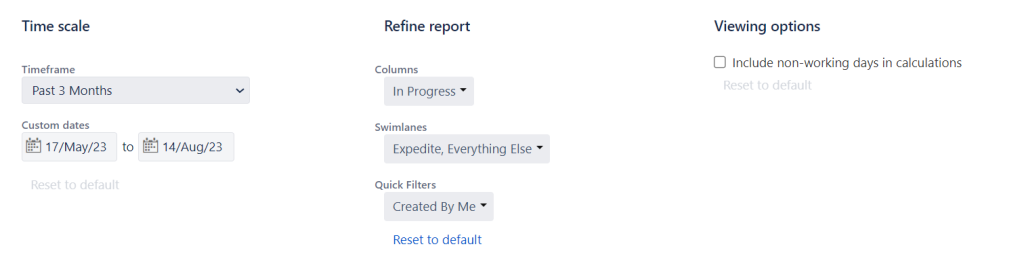
Filtering and Segmentation: With an abundance of data, filters become indispensable. They streamline data, making it digestible and actionable. Filters can segment data based on issue types or their creators.
Using Columns for Cycle and Lead Time: By selecting specific columns, users can analyze particular stages in detail.
Practical Applications
Predictability and SLA: Control charts are adept at laying out service level agreements and presenting a historical outlook on average completion times. This plays a pivotal role in gauging productivity and handling stakeholders.
Problem Solving and Trend Diagnosis: Delving into the intricacies of a control chart enables teams to spot areas needing improvement. The goal is to gradually reduce the rolling average and dissect outlier items for better insights.
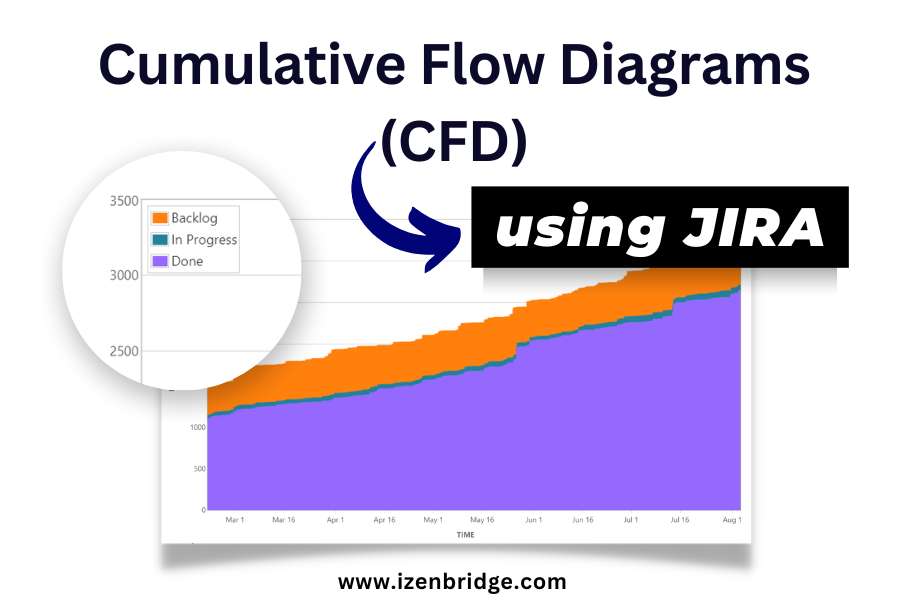
Integration with Other Tools: These charts aren’t standalone. When combined with tools like cumulative flow diagrams, they paint a comprehensive picture of a project’s vitality and efficacy.
In summation, Jira control charts aren’t just about pretty graphs and numbers. They’re a window into a project’s soul, offering a bird’s-eye view of where things stand, where they’re headed, and how to make them better. Whether you’re a project manager, developer, or stakeholder, understanding and utilizing these charts can be the difference between a project’s success and mediocrity. We provide Jira training and consulting, do connect with us if you want make Jira work better for you.