Cumulative flow diagrams (CFD) are essential in agile project management methodologies like Kanban. These diagrams offer a visual representation of work as it progresses through different stages. In this article, we will delve into the intricate details of a CFD using popular tools Jira, focusing on how to interpret and make the most of these diagrams in real-world scenarios.
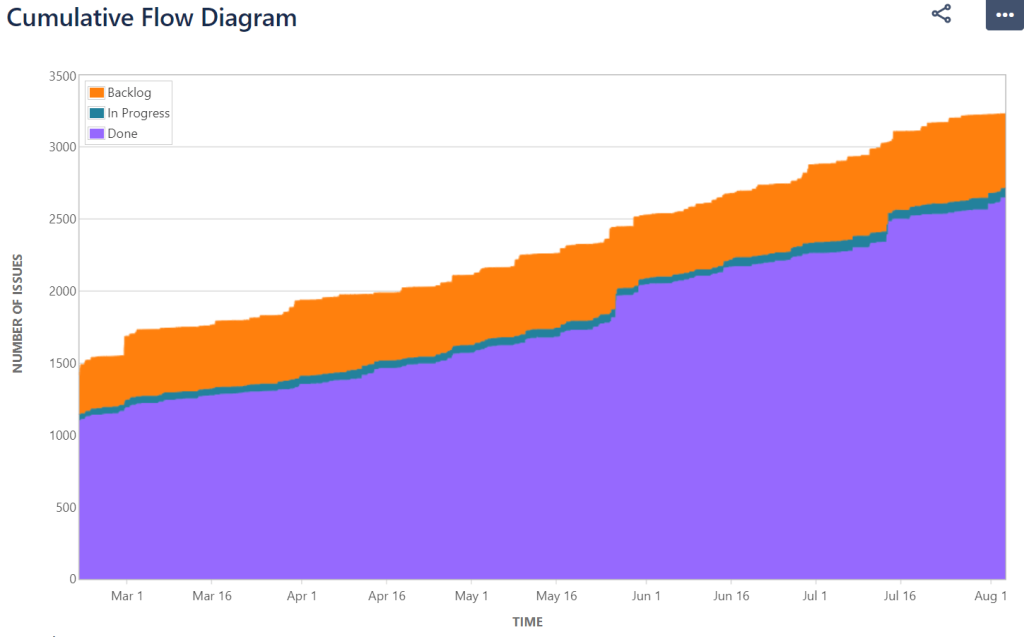
A Kanban board serves as a visual tool to represent a project’s workflow, providing a comprehensive view of different work items as they transition between various statuses. By employing the information from the board, a Cumulative Flow Diagram (CFD) can be plotted, offering an insightful reflection of the project’s state at various time intervals.
Within the context of a typical CFD:
1. Open Your Jira Project: Open your project in full screen
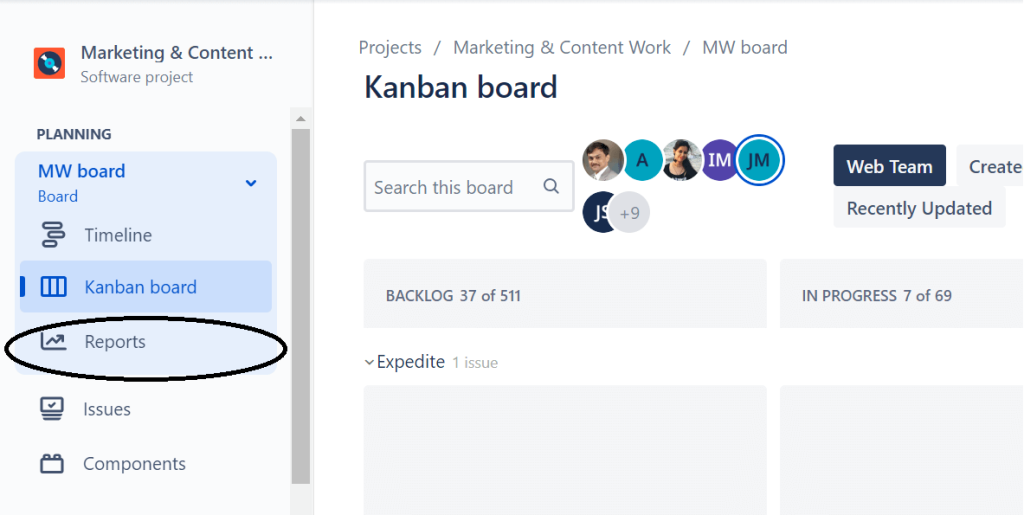
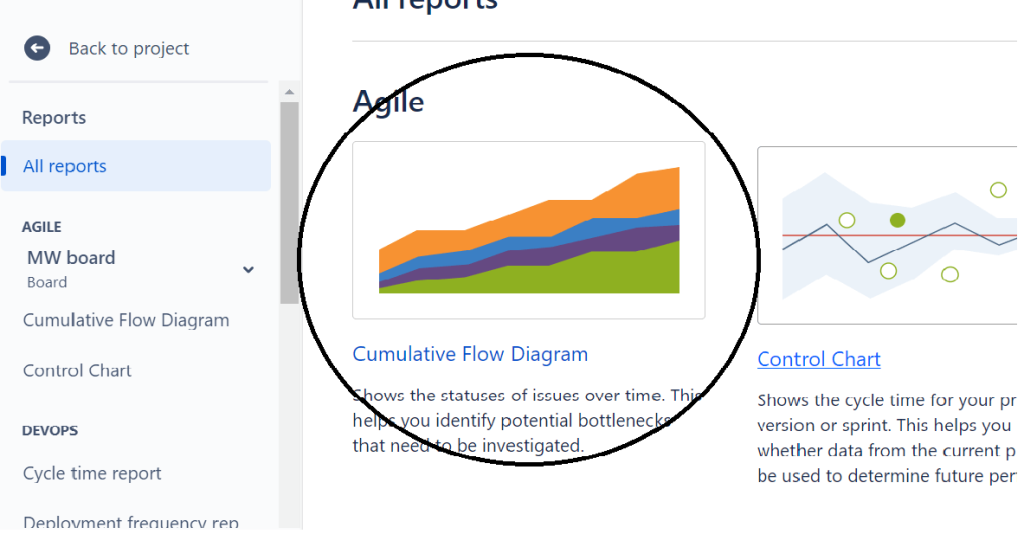
2. Navigate to Reports: In the reports section, you can access the cumulative flow diagram.
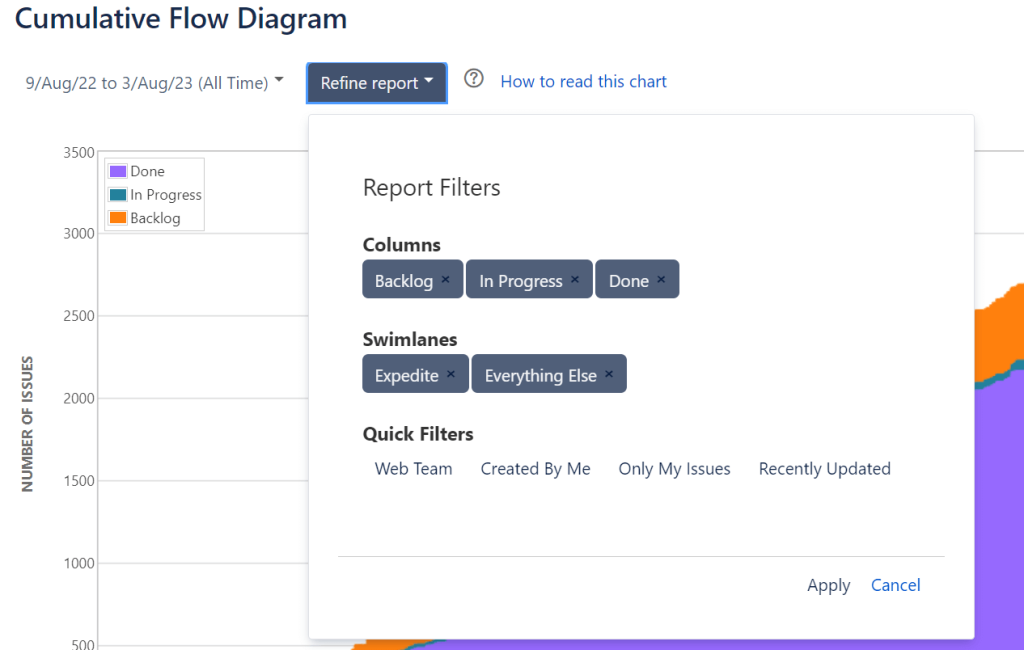
3. Refining and Filtering : Jira allow you to gain specific insights. You can:
Understanding the Movements
The CFD provides insight into how work items are progressing through different stages. It helps visualize:
Role-Specific Insights
Team Level Filters
You can create team-level filters as quick filters to monitor a specific team’s progress. For example, you might see the departure rate of work for a web team, revealing potential areas of concern if items are not being marked as completed.
Validating the Data
The CFD needs to be accurate and align with the real state of the project. Here’s how you can validate the information:
Cumulative flow diagrams are powerful tools for visualizing the flow of work in a project. They allow project managers, product owners, scrum masters, and teams to see the status and progress of work items, identify trends, and take informed actions.
Grasping the complexities of Cumulative Flow Diagrams (CFDs), from interpreting different elements to refining and filtering the associated data, equips project managers with critical insights into their projects’ progress and challenges. For those interested in delving deeper into the capabilities of Jira, our Jira Training program offers a robust curriculum tailored to enhance your skills. The accompanying video below provides a comprehensive overview of Cumulative Flow Diagrams, elucidating its functionality and application in project management.
No Trainings found

Since most of the teams are working in distributed environments, more and more teams are ...

As a project manager, you might have come across the term “product backlog” while working ...

The traditional way of looking at project/product requirements involves thinking about the complete customer needs ...