If I have to choose one topic which creates maximum buzz in the project management community, I will go with Work performance data and work performance reports.
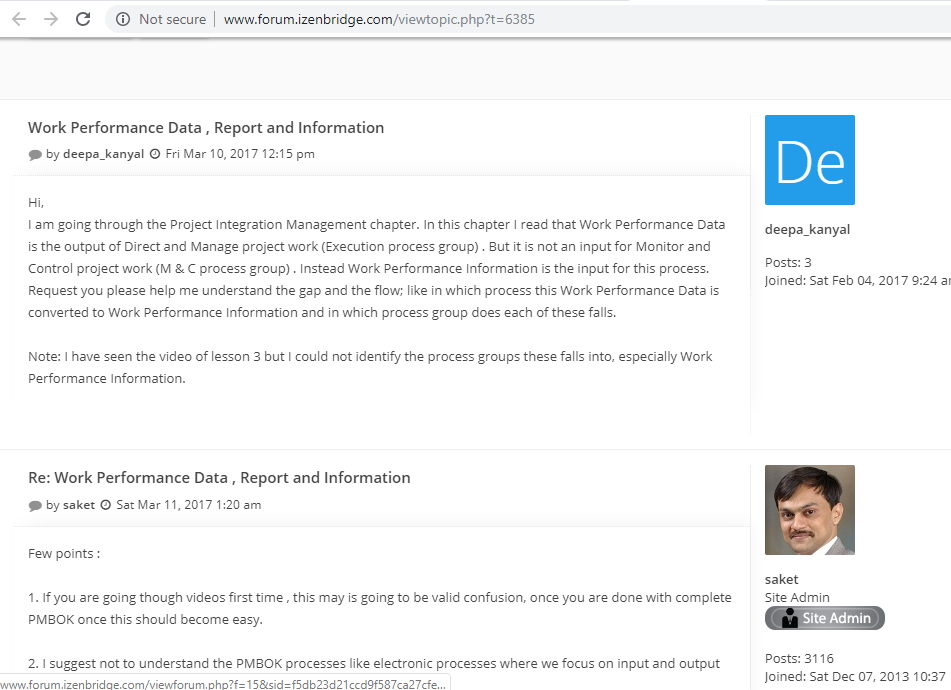
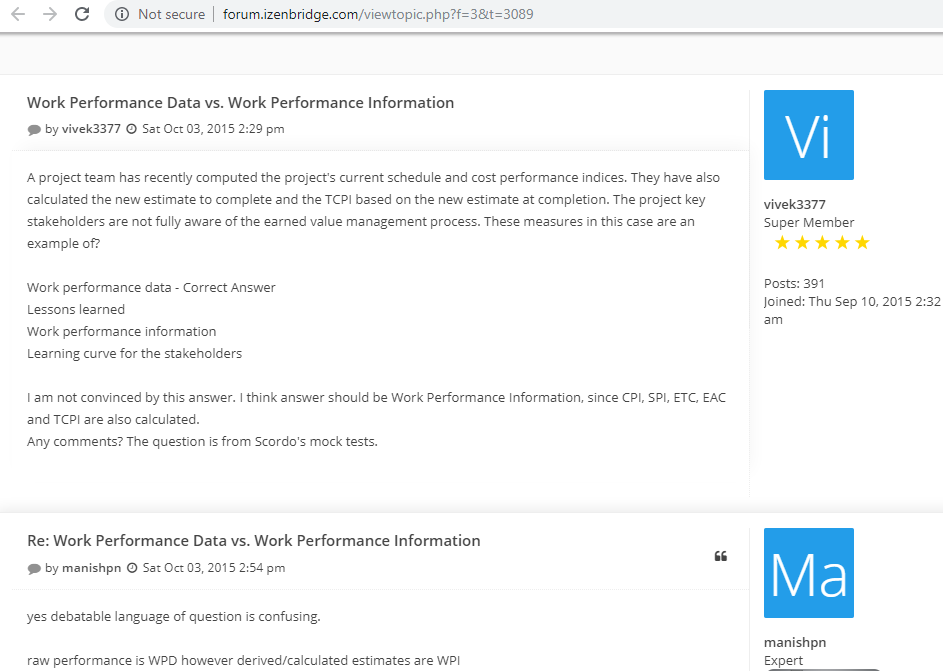
Sometime, the confusion arises while trying to understand WPR and WPI from the PMBOK® Guide Sixth Edition definition.
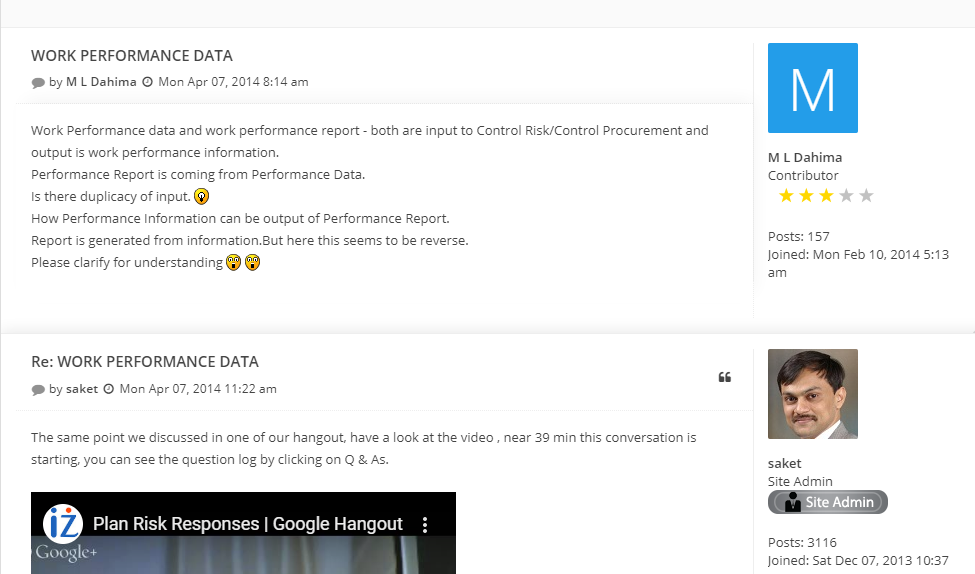
You can follow this discussion here
Sometime, the confusion arises while decoding the questions based on WPR and WPI
By the end of this blog, you will have a clear distinction between WPI and WPD.
Read on…
Project data is the backbone of any project. Managing project data is one of the highways to project success. In a project, we need to find proper ways:
– To collect various raw data related to various knowledge area’s project activities.
– Analyze and integrate them based on relationships across knowledge areas,
– Present this analysis based on stakeholder needs.
Let’s explore how we can relate activities mentioned above with:
Here, I am beginning with the answer to what is Work Performance Data?
PMBOK® Guide Sixth Edition defines work Performance Data as:
The raw observations and measurements –
identified during activities being performed to carry out the project work.
In simple words, based on the project plan when we execute project activities, we generate a lot of data. This is Work Performance Data. Below are a few examples but not limited to:
These Work Performance Data comes from the Direct and Manage Project Work.
We have to understand these project data, compile them, and make a complete health report. Else, there’s no way we’ll get project goals.
Analysis of data creates Work Performance Information, and their compilation and integration create Work Performance Reports.
So after data generation by project execution, what is next step here? The next step is to analyse and understand all project data to get Work Performance Information. Now the question is – What is Work Performance Information? How to get this information? Which PMBOK® Guide process creates Work Performance Information?
Let’s first see how PMBOK® Guide Sixth Edition defines Work Performance Information:
The Work performance data collected from various controlling processes analyzed in comparison with project management plan components, project documents, and other work performance information.
Below are a few examples
PMBOK® Guide sixth edition defines ten knowledge areas. And, each knowledge area has a controlling process which sees how execution is going on as per the plan? Like, Control Schedule monitors the status of various scheduled activities. Let’s take an example here: you were expected to do a requirement gathering session, but somehow it did not happen. The control schedule process gives information about the variance of schedule. It communicates behind schedule information.
Since here information is in the form of variance, it is easier to make some sense help in taking decisions.
Here, the control Schedule process takes Work Performance Data as an input. This Work Performance Data comes from the Direct and Manage Project Work. And, the Control Schedule process uses this information to generate Work Performance Information. At this point, the data says the status of Requirement Gathering session. And, Control Schedule takes this information to create variance information.
In the same way, other knowledge areas controlling processes watch the status of their areas. And check how things are going as per the plan. Based on this monitoring, these controlling process produces information. It is Work Performance Information help in knowing the health of its knowledge area.
Understanding the health of a particular knowledge area is not enough. If we need to see the complete health of the project, we need to integrate these information. This integration and compilation result in the Work Performance Report. This report gives a complete health report for the project. Let’s see what is the Work Performance Report?
Work Performance Report is the physical or electronic representation of work information compiled in project documents, intended to generate decisions, actions, or awareness.
I know now it is time to see which PMBOK® Guide process generate work performance Report? It is the Monitor and Control Project Work process. This process receives Work Performance Information from all knowledge areas controlling processes. This process integrates this information to get the Work Performance Report.
Below are a few examples
So consolidating one example of all three WPD, WPI, and WPR
“You have been informed that project has completed 40% of planned work with six days of delay.”
WPD: 40% complete in itself is a raw data
WPI: Any derived information is WPI when you compare the actual with planned data and derives some information from the following available data:
The budget of the project is 100,000 USD
Actual Cost (AC) is 60,000USD Planned Value (PV) is 50% of 100,000
= 50,000 USD
Earned Value is 40%of 100,000
= 40,000 USD
Now, Schedule Variance =Earned Value – Planned Value
= 40,000 – 50,000
= – 10,000 USD
The project’s Schedule Variance is -10,000 USD. – This value is WPI and gives information that we are behind schedule since it is negative.
WPR: When you report this information in a certain format – Bar graph, Gantt Chart, etc then it is WPR. Monitor and Control Project Work takes WPIs from all knowledge areas controlling processes. And then it gets a consolidated project status in the form of various graphs, charts, etc.
While analyzing reports, stakeholders can identify changes which go to the change control. And after approval of these changes, the project management plan gets updated. Based on the updated plan, execution is done, and work performance data are generated. These data are analysed further to produce Work Performance Information. Again these work performance information is integrated to get the Work Performance Report.
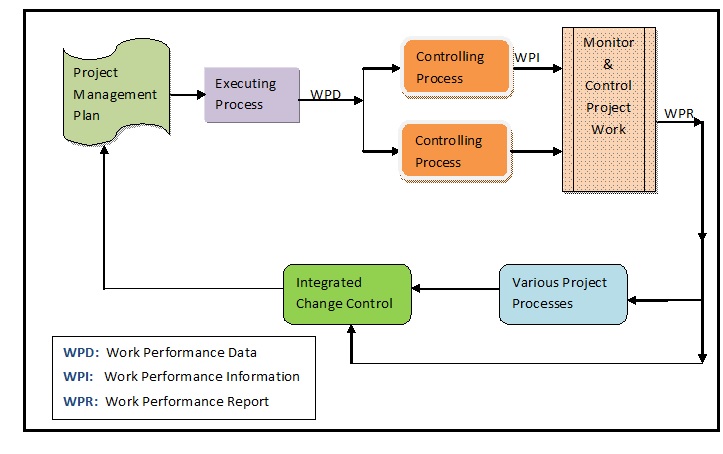
In this way, you can see it is a repeated cycle of getting work performance data, work performance information, and work performance reports. Let’s see below the diagrammatic representation of all these three critical data, information, and report items. It shows how these are generated and gets repeated during the project life cycle:
The Prime Minister of India always needs complete health information of the country handy. This information is the reflection and integration of different verticals of the country. Different cabinet ministers are responsible for taking care of their verticals. These ministers are responsible for coming up with health information about their area. They lead the execution of different government schemes of their verticals. The implementation of these schemes generates data like:
These cabinet ministers are also responsible for processing these data (Work Performance Data) to generate information. It is Work Performance Information which includes but not limited to:
This WPI goes to the PMO India, which integrates and compiles all this information and generates a report. It is Work performance report, which shows the complete picture of the country. It shows how it is moving as per the plan and what the current health status of the country is. Finally, this report goes to the Prime Minister. This report aims to see complete health information at a glance.
Let’s see a simple flow of getting Work Performance Data, Work Performance Information, and Work Performance Report:
The following video will give you a full flow and journey of getting Work Performance Report
Frequently Asked Questions on Work Performance Data, Work Performance Information, and Work Performance Report
Answer:
WPD: it is a raw observation of work which is getting executed
WPI: It is a processing result of raw data
WPR: It is the integration of all WPI
Now’ let’s go in details to get some examples of WPD, WPI, and WPR to easily differentiate between WPD, WPI, and WPR.
First, we observe what are raw observations and measurements as a result of work getting executed in Direct and Manage Project Work. It is like we do something based on the plan, and we observe data as a result of that execution. Following are a few examples, but not limited to:
Now, as this data is raw, we need to process it. This processing helps us to make some sense related to a particular knowledge area.
In other words, we pass this data to the controlling process for further analysis. This process creates Work Performance Information. Following are the examples of WPI – here I tried to take examples from all ten controlling processes of knowledge areas
Now, the next step is to integrate all these WPIs. These WPIs are coming from individual knowledge areas to make a complete report. After integration of these WPI’s, we get WPR. This WPR is combined, recorded, and distributed to stakeholders. The Monitor and Control Project Work take WPI from all controlling processes and make it this combined report. Following are the few examples of Work Performance Reports, but not limited to:
Answer:
Work Performance Data are the raw observations of the work which is getting executed. This raw data is further analyzed to create work performance information. The controlling processes do this analysis produces WPI.
| Name | Date | Place | – |
| PMP Certification and Training | 15 – 30 November 2025 | Bangalore | More Details |
| PMP Certification and Training | 9 Dec’25 – 7 Jan’26 | Chennai | More Details |