We can only solve problems when we see them, which is why keeping things transparent is one of the essential needs of managing project work. Boards and Reports in Jira help us in keeping things visible to all stakeholders .
A board displays all the issues that occur within the project, providing us with a flexible way of viewing, managing, and reporting the progress on work. There are three types of boards in Jira Software:
Scrum board: This board is useful when teams work on sprints that include a backlog.
Kanban board: Kanban board is an agile project management tool designed for the visualization of work, constraining our work-in-progress, and maximising efficiency. Includes the option of a Kanban backlog.
Team-managed board: This board is useful for the team who are new to agile. The set-up is simplified, straightforward, and streamlined, delivering more power progressively as we need it.
We can use a board that is created by someone else, or we can create our board as many boards as we like. A project can have multiple boards and a combination of Scrum, Kanban, and agility boards.
Scrum board is divided into three parts:
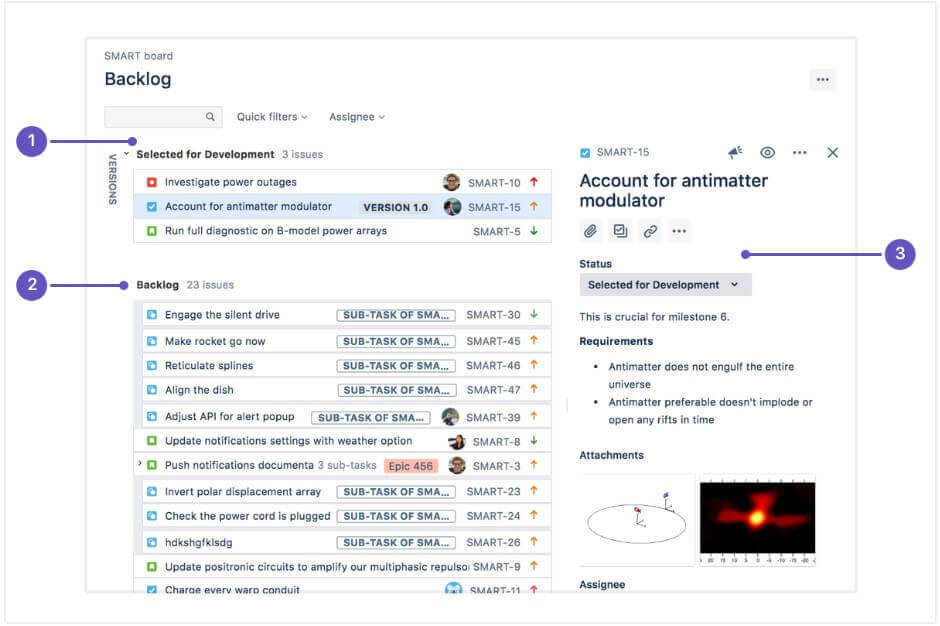
Backlog
The Backlog shows the set of activities or issues available in a project grouped into a backlog and sprints. In the Scrum backlog, we can create and update issues, drag and drop issues to rank them, assign them to sprints, epics, or versions, manage epics, and more. We can use the Scrum backlog when building a backlog of issues, planning a new version, and planning a sprint.
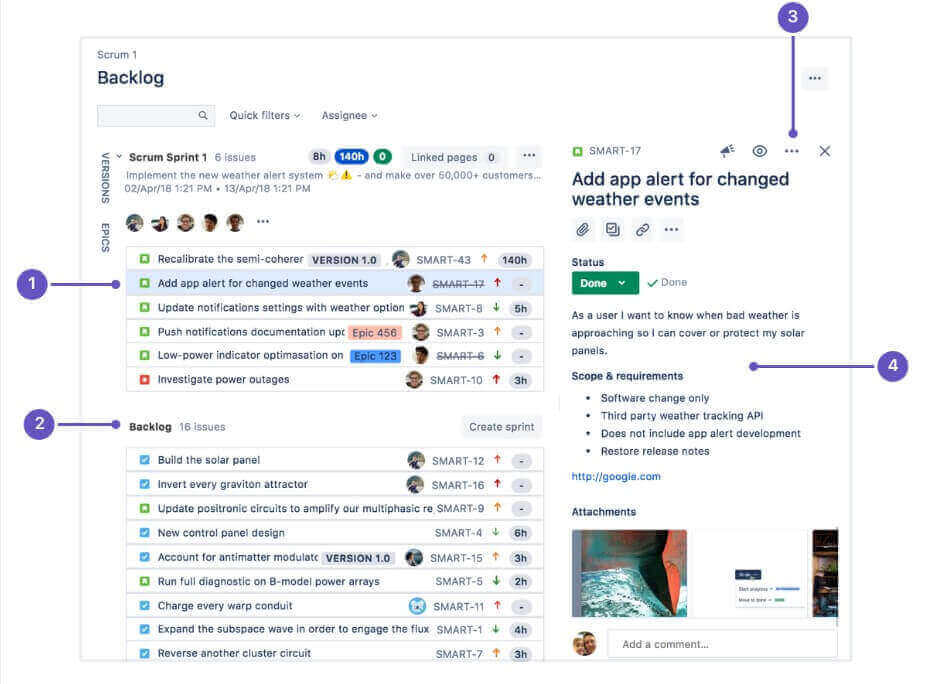
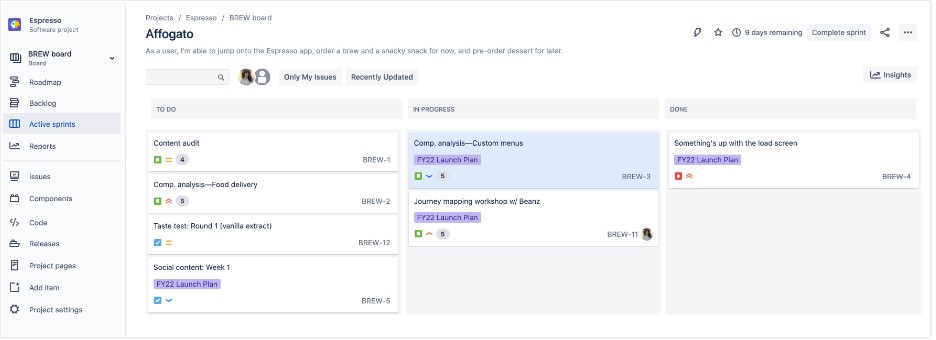
Active sprints
Active sprint is a sprint that contains the issues on which the team is currently working. We can create and update the issues and drag and drop issues to transition them through a workflow or move it to the backlog.
Steps to create and start sprint:
Reports
Reporting is an activity that will be performed throughout a project. Jira Software has a range of reports that are made which are used to show the information about the project, versions, epic, sprints, and issues.
Kanban is a process that provides the visualization of all the work which you are doing today.
Kanban consists of three parts:
Backlog
By default, the Kanban board has a separate column of Backlog from where we plan the work for our team. Planning of work in a small column becomes very difficult as more issues are added to the column, so enabling and using the Kanban backlog that provides a bigger space for handling the issues which makes it easier to create and rank issues and select issues for your team to start working on.
When we create an issue, then it is added to the Backlog automatically
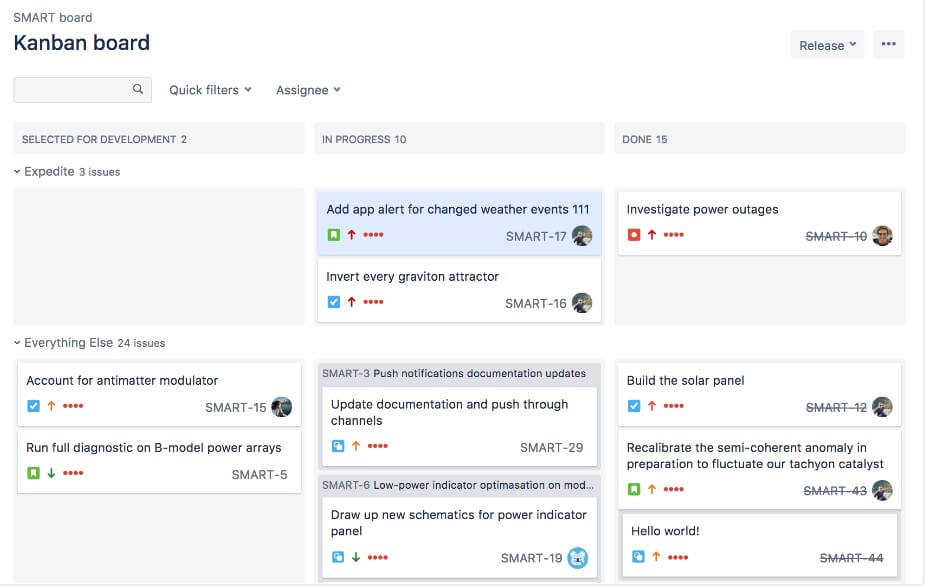
Kanban
Kanban is a process based on the continuous delivery of work. Rather than plan iterations, the flow of work is constantly monitored means that when the tasks are completed, then the new tasks are pulled into work-in-progress.
Kanban board consists of three states:
Reports
Reporting is an activity that will be performed throughout a project. Jira Software has a range of reports that are made which are used to show the information about the project, versions, epic, sprints, and issues.
Team-managed boards are just like company-managed Scrum and Kanban boards. But instead of giving you all the features from the start, they start with very limited features. It is up to us to enable whatever features we need. This way we can see only the information we need and is flexible enough to adapt to our team as it grows.
Reporting in Jira Software
Jira reports help to analyse progress on a project, track issues, manage their time, and predict future performance. They offer critical, real-time insights for Scrum, Kanban, and other agile methodologies, so that data-driven decisions can be made.
Type of Reports
JIRA has categorized reports in four levels, which are −
Basic Features of Jira Reports
Let us now discuss the features/purposes of the reports that we can access from Jira boards in detail-
Agile Reports
Following is the list of features of Agile Reports.
Burn down Chart-Track progress towards sprint goals to manage progress and respond accordingly.
Sprint Chart − Determine overcommitment and excessive scope creep and understand completed work in each sprint.
Velocity Chart-Track work from sprint to sprint to help teams determine the velocity and better estimate the work a team realistically achieve in future sprints.
Cumulative Flow Diagram − This shows the statuses of issues over time. It helps to identify high-risk issues or unresolved important issues.
Version Report − Track the projected release date for a version.
Epic Report − This shows the progress towards completing an epic over a given time.
Control Chart − This shows the cycle time for the product, its version, or the sprint. It helps to identify whether data from the current process can be used to determine future performance.
Epic Burn Down − Track the projected number of sprints required to complete the epic.
Release Burn Down − Track and monitor the projected release date for versions and act if work is falling behind the projected schedule.
Issue Analysis
Following is the list of features of Issue Analysis.
Average Age Report − Displays the average age in days of unresolved issues.
Created Vs Resolved Issue Report − Display the number of issues created vs the number of issues resolved in a given period.
Pie chart Report − This shows a pie chart of issues for a project grouped by a specified field.
Recently Created Issue Report − This shows the number of issues created over some time for a project and how many of those were resolved.
Resolution Time Report − Displays the average time taken to resolve issues.
Single Level Group By Report −It helps to group the search results by a field and see the overall status of each group.
Time since Issues Report − It helps to track how many issues were created, updated, resolved, etc., over a time period.
Forecast & Management
Following is the list of features of Forecast and Management type of reports.
Time Tracking Report − This shows the original and current time estimates for issues in the current project. It can help to determine whether work is on track for those issues.
User Workload Report − This shows the time estimates for all unresolved issues assigned to a user across projects. It helps to understand how much a user is occupied, whether overburdened or has less work.
Version Workload Report − Displays how much outstanding work is remaining per user and per issue. It helps to understand the remaining work of a version.
Steps to Access Reports
If you have any specific questions on Jira reporting, please share that in the comment area. You may also want to check our Atlassian Services and Jira Training offerings.
No Trainings found