PMP Q #31- Velocity Chart
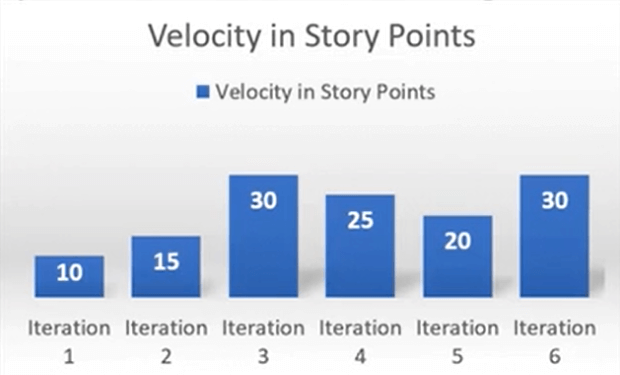
Q31. Based on the velocity chart of the last 6 iterations, how many iterations do you estimate for finishing 100 story points of work?

A. It can’t be calculated
B. 3 to 4 iterations
C. 4 to 5 iterations
D. 5 to 6 iterations
In this question, you need some calculations and some understanding of Agile.
Let’s first explore – “What is velocity?” And how it helps calculate the number of iterations in the release.
The velocity represents the quantum of work a team can mark done in a given iteration. So simply 100 Divided by velocity tells me the number of iterations. So can you read that information from this particular bar chart?
The length of the bar represents the velocity observed in a given iteration. You can see that there are different velocities for different iterations. Here, you have 100 points of work done, and you can divide it by the velocity and find out how many iterations this particular work will need. But here, you don’t have a given velocity. Instead, you have a chart, so what do you need to calculate the number of iterations required?
In general, you use velocity data from recent iterations. If you see the trend in the bar chart and take the average, it may come to around 22 – 23. But is it relevant to refer to velocity from the recent three iterations and take the average out of that recent number to calculate, predict or estimate rather than, say, to estimate the future velocities. Here, you should focus more on the last three iterations than the previous 3. Yeah, so you concentrate on 20,25 and 30. Now, if you take an average, it comes to around 25. The pessimistic estimate could be 20 because out of the last three, 20 was the slowest and 30 was the fastest. So if you go the fast speed, you still need three plus iterations. You need more than 3. Yeah, and if you go slow, you need five iterations because 100 / 20. So it takes around 4 to 5 iterations, and that’s why option C wins here because the pessimistic could be 20. Your optimism could be 30, and Most Likely is around 25; looking at that, 4 to 5 iterations are good enough.
So pessimistic will go towards 5, optimistic could be three and a half or something, but we better focus on the manageable number, 4.
Sometimes, you may face just one number, but you still need to use your judgment. Take the recent observation and focus more on the recent data than the past data. And this is how you can calculate the number of iterations needed for the given work.
