A flowchart, one of the seven basic quality tools, is defined as a graphical presentation used to describe and visualize the sequence of events within a process. It is a valuable tool in the context of the Project Management Professional (PMP) exam, where it can help in understanding and analyzing project processes. A process is a series of activities aimed at achieving specific objectives. It involves inputs, decision branches, and outputs. Flowcharts are valuable tools for visualizing the sequential or parallel sequence of events in a process. They provide a clear representation of the activities involved, enabling effective analysis and understanding of the process flow.
The flow chart can be defined as per its application in the PMP exam –
The depiction in a picture format of the input, process actions, and outputs of one or more methods within a System.
In summary, the purpose of a flowchart is to help understand the inner workings of a process and identify potential errors or variations. Examining the detailed steps involved in a particular task makes it easier to pinpoint the causes of discrepancies or quality issues. Flowcharts serve as a tool for in-depth analysis of process sequences and how individuals perform specific tasks.
Flowchart Example:
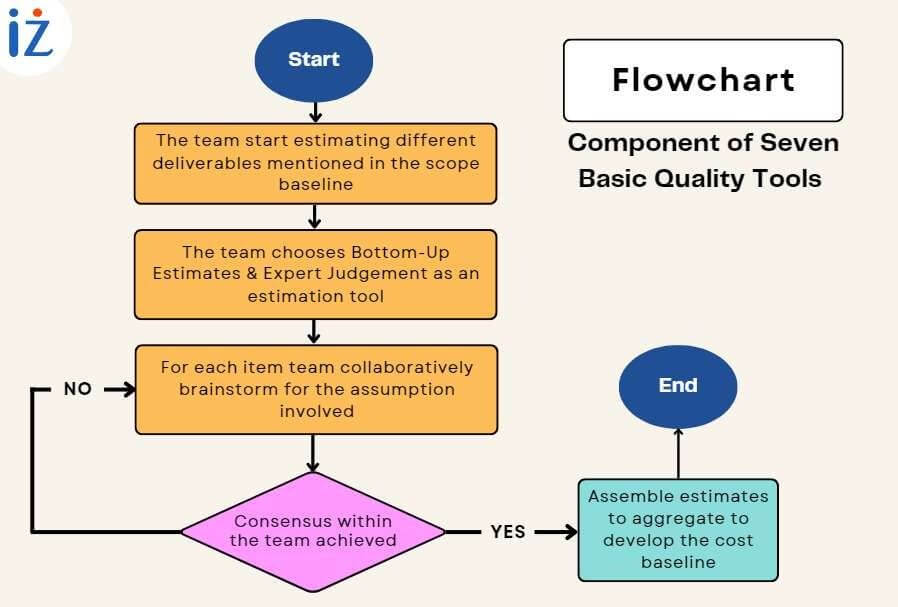
Let’s consider a scenario where a team needs to estimate the items that have been identified in the scope baseline. In order to achieve realistic estimates, the following steps need to be taken iteratively.
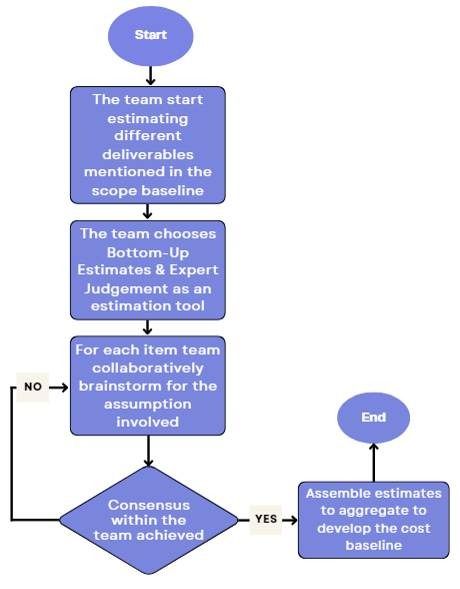
Development of Flowchart -The development of a flowchart involves establishing a clear understanding of the inputs, outputs, decision points, and the basis for making decisions. Many professionals utilize SIPOC (Suppliers, Inputs, Processes, Outputs, Customers) as an input to create a visual representation of a process.
In this case, SIPOC (Supplier, Input, Process, Output, and Customer) serves as a model for documenting a process from start to finish. SIPOC is a result of a brainstorming session between a selected group of team members and other SME(s). In order to develop the SIPOC model team starts with the ‘P’ of SIPOC for the steps of processes. After identification of the process steps, a list of output and customers are identified. The team continues from backward of SIPOC, i.e., beginning with the supplier (S), and then inputs of the processes are identified. The result of SIPOC is generally represented in the table as mentioned below; here, numbers are allotted to each head of the table according to their sequence of consideration:
| 4. Supplier | 5. Input | 1. Process | 2. Output | 3. Customer |
| 1. PMO to provide guidelines to develop estimates | 1. Get scope baseline items to estimate 2. Get the team to develop estimates 3. Get risk register & time phase spending plan 4. Identify unit of estimates from cost management plan | 1. Choose the team 2. Review with team all necessary inputs to perform “Estimate Cost” 3. Discuss tools to generate realistic estimates. 4. Get consensus for the tool to be used 5. For example Bottom Up estimate and 6. Expert Judgement gets selected Get consensus for the reserve needs of items to get a range of estimates. 7. Get estimates for each item 8. Assemble estimates to develop a cost baseline | 1. Estimates for each selected item 2. Assumptions involved in estimates | 1. Team 2. Business Stakeholders 3. “Determine Budget” Process 4. “Identify Risk” Process 5. “Estimate Activity Resources“ Process 6. “Plan Procurement Management” Process |
Important Usage of Flowchart in the Context of PMP Exam:
Overall, flowcharts serve as a visual aid in analyzing, improving, and monitoring processes, facilitating efficient project planning and quality control. Flowcharts are particularly beneficial for detailed analysis and effective communication of complex processes to stakeholders.
I trust that this blog has effectively addressed all your inquiries regarding the flow chart in the context of PMP and its significance in quality planning, quality control, and visualization of workflows and processes. For a visual presentation and further understanding of flowcharts, you can watch this video:
If you have aspirations to pursue the PMP certification, enroll with us for comprehensive support in your PMP certification journey. We offer expert guidance in exam preparation, assistance with the application process, and help in scheduling the exam. With our assistance, you can confidently navigate the certification process and increase your chances of success.
iZenBridge offers a wide range of comprehensive FREE resources to support you throughout your PMP certification journey. Explore our PMP Free Practice test, which provides a realistic simulation of the actual exam and helps you assess your preparedness with up-to-date questions. Our 50 Agile PMP Questions tutorial also delves deep into essential PMP Agile concepts, such as working with Requirements, value delivery, Agile Metrics, incremental delivery, and feedback. These tutorials provide detailed explanations and expose you to common Agile-related PMP exam questions. Whether you’re new to Agile or seeking to strengthen your understanding, our scenario-based PMP Agile questions are valuable tools for effective concept comprehension.
| Name | Date | Place | – |
| PMP Certification and Training | 4 May – 2 June 2024 | Chennai | More Details |
| PMP Certification and Training | 6 June – 5 July 2024 | Pune | More Details |

Histogram As A Component Of Seven Basic Quality Tools In the Project Management Professional (PMP) ...
A Check Sheet is one of the 7 basic quality tools relevant to the Project ...
In the context of the PMP exam, a Cause-and-Effect Diagram, also known as an Ishikawa ...
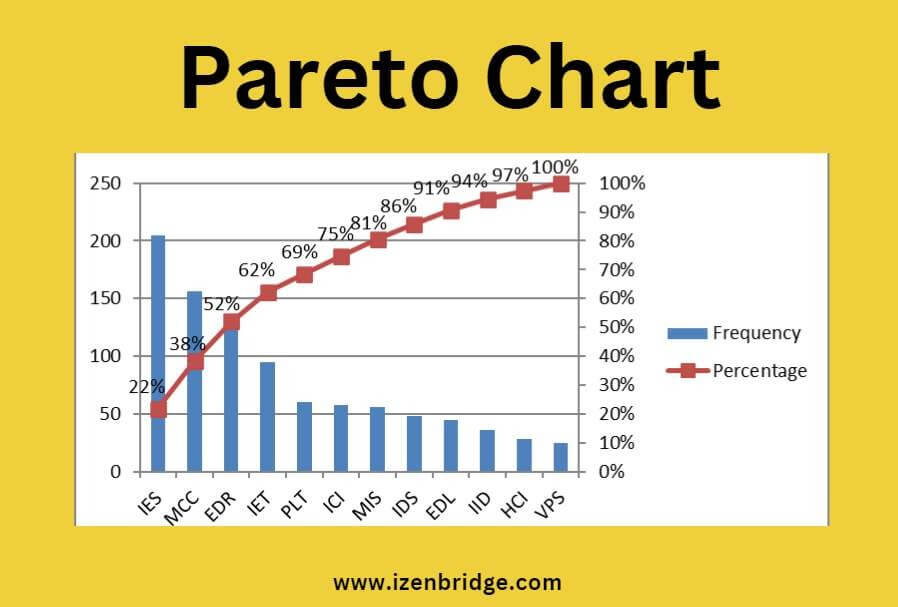
The Pareto Chart is a valuable technique in the PMP exam for identifying the most ...
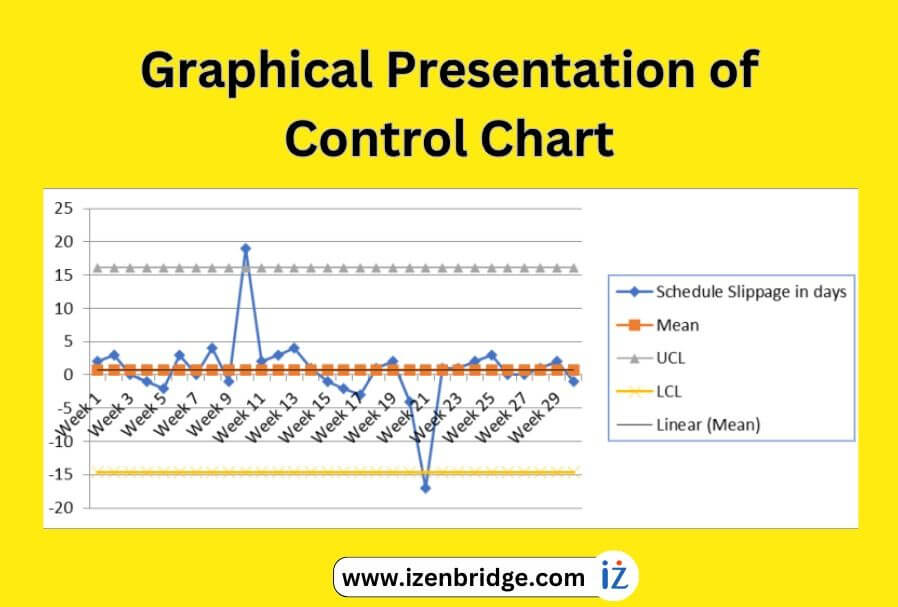
A control chart, a valuable quality tool in the PMP exam, helps us gain insights ...
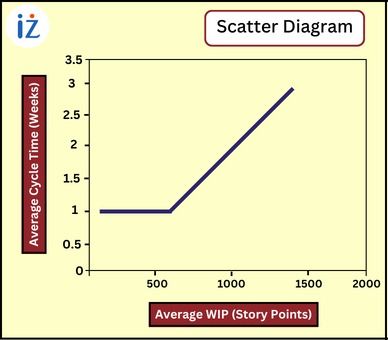
A scatter diagram in the PMP exam is a quality tool that aids project managers ...