A Check Sheet is one of the 7 basic quality tools relevant to the Project Management Professional (PMP) exam. Its primary objective is to prevent and detect problems by systematically collecting valuable, structured data on quality issues. The Check Sheet is versatile and can gather qualitative and quantitative facts about quality problems. It is commonly known as a tally sheet when employed specifically for collecting quantitative data.
In the context of the PMP, the Check Sheet is defined as:
A check Sheet is a tally sheet that can be used as a checklist when collecting data. It provides a structured format for recording data, making it easier to spot patterns and trends. It helps to make data-driven decisions and take appropriate actions for improvement.
Differentiating Check Sheet with a checklist:
Some professionals get confused in check sheets and checklists. The check sheet is not a checklist; the checklist is basically a listing of items that need to be considered for the purpose of accuracy and completeness. For example, maintaining a daily to-do task list is a good example of a checklist, while the check sheet is a collection of facts about a problem categorized by its cause, types, and/or location.
The following table further explains the difference between check sheet and a checklist:
| Check Sheet | Check List |
| The check sheet conveys information about the frequency of problems by type, causes, and/or location | The Checklist is used to include all the necessary steps needed to ensure the accuracy and completeness of a work product or process. The Checklist can be used when working on a checksheet to ensure its accuracy. For example, what steps should be followed to develop a check sheet while collecting real-time data? |
| It is typically developed and agreed upon by team members based on the specific needs of the project. For instance, the team may choose to develop a check sheet to track the frequency of problem sources, or they may opt to capture the frequency of data categorized by causes. In other words, the check sheet is customized by the team to suit their requirements. | For a process, the structure of a Checklist is typically derived from documented standards. On the other hand, a checklist resembling a to-do list may be influenced by other factors, such as an individual preparing a to-do list based on the expectations that have been set. |
| This tool serves to document factual information regarding interruptions or problems that arise as a result of a quality control process. | This tool is used to record the necessary steps required to achieve an objective. |
Differentiating Check Sheet with a Matrix Diagram:
In the realm of PMP exams, test takers often encounter confusion between check sheets and matrix diagrams. While a matrix diagram is a tool used in quality management to analyze the relationship between two variables, a check sheet serves a different purpose. A matrix diagram presents data in a matrix format, enabling visual representation and comparison of data points to identify patterns, connections, and interactions. On the other hand, a check sheet focuses on collecting data and observations, providing a structured method for organizing information. The key distinction lies in the fact that a matrix diagram analyzes relationships and interactions, while a check sheet captures data for further analysis and decision-making.
To gain a visual understanding of Check Sheets and distinguish them from Checklist and Matrix Diagrams, I recommend watching this informative video. It provides a clear presentation that enhances comprehension and highlights the differences between these three tools.
Where Check Sheet Is Used?
The check sheet is one of the seven basic quality tools and is utilized as a Tool & Technique in planning and controlling quality. In this context, the primary objective is to provide an explanation of the check sheet and its relevance to these two processes.
Past project records can be used to identify process improvements and prevent defects when planning a project. For example, if the same team is involved in the current project as in the previous one, analyzing factual data can help understand how they executed processes and identify areas where defects can be prevented in work products. If the check sheet from past projects reveals a significant number of defects categorized as “misinterpretation of customer requirements,” it suggests the need for a process improvement plan for collecting requirement process. Additionally, quality policies within the quality management plan can be established, along with metrics, to measure future work performance and processes.

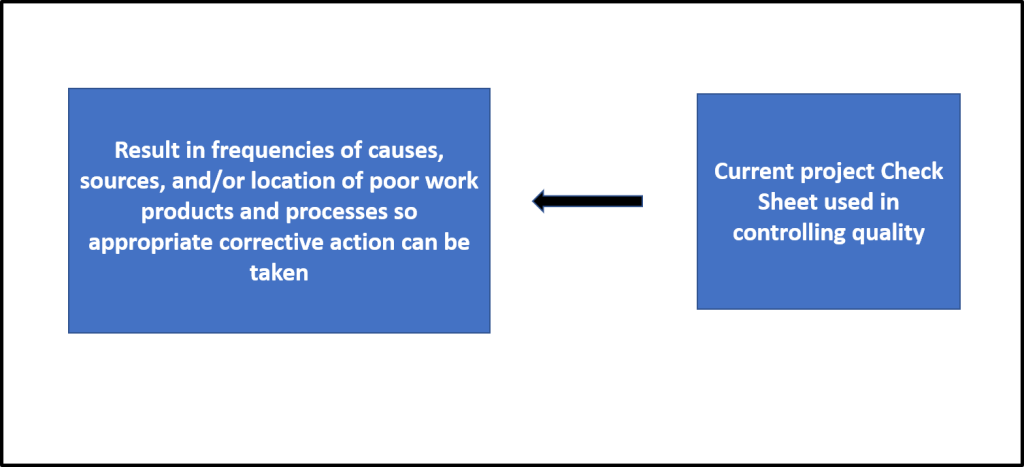
The check sheet is utilized as a Tool & Technique in controlling the quality to track the frequencies of problems in a format that is agreed upon by the team.
Example Check Sheet:
To illustrate the concept, let’s consider a software project example. In this case, you can use a check sheet to display the frequencies of quality problems categorized by their causes. This approach helps you identify common issues and their underlying causes, facilitating a deeper understanding of the project’s quality.
A test team member is responsible for evaluating work products to identify problems based on the specifications. The team may choose to categorize data about quality problems into the following categories:
Categories suggested by Roger S. Pressman:
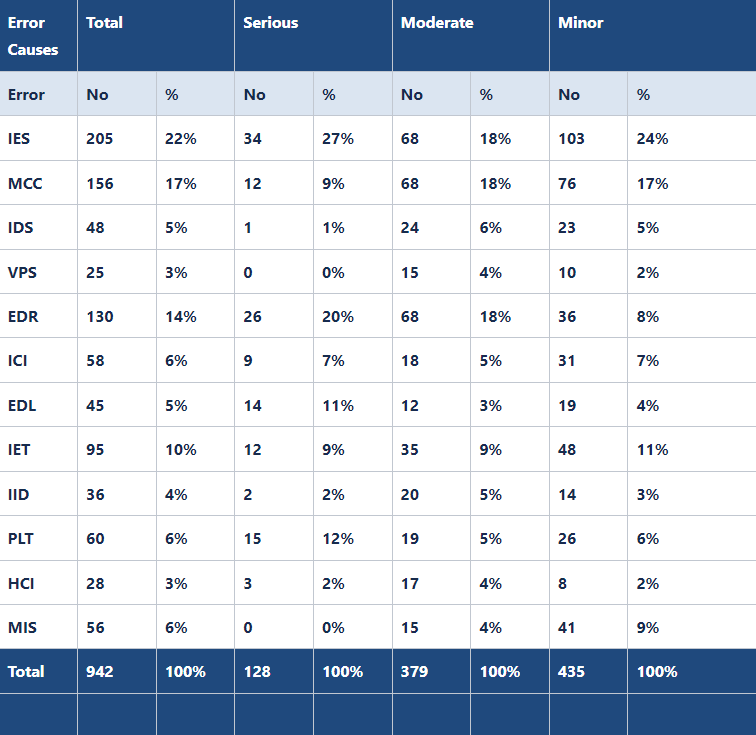
While examining the work product, the test team member assesses the defects and records their frequencies in their respective categories of causes, such as:
Check Sheet suggested by Roger S. Pressman in software engineering a practitioner’s Approach:
Benefits of Check Sheet:
In Conclusion, check sheets play a significant role in project quality planning and control. It is a versatile tool that facilitates data collection, organization, and analysis. Check sheets generate quantitative data for quality problems and support other tools such as Histograms and Pareto analysis. It also captures qualitative data based on the observer’s intuition, judgment, and feelings. Used in Agile retrospectives or sprint reviews, check sheets aid decision-making and drive continuous improvement. With their structured format, check sheets are essential for monitoring and observing project quality, making them relevant for the PMP exam.
I trust that this blog has effectively addressed all your inquiries regarding check sheets and their significance in quality planning and control.
If you have aspirations to pursue the PMP certification, enroll with us for comprehensive support in your PMP certification journey. We offer expert guidance in exam preparation, assistance with the application process, and help in scheduling the exam. With our assistance, you can confidently navigate the certification process and increase your chances of success.
iZenBridge offers a wide range of comprehensive FREE resources to support you throughout your PMP certification journey. Explore our PMP Free Practice test, which provides a realistic simulation of the actual exam and helps you assess your preparedness with up-to-date questions. Our 50 Agile PMP Questions tutorial also delves deep into essential PMP Agile concepts, such as working with Requirements, value delivery, Agile Metrics, incremental delivery, and feedback. These tutorials provide detailed explanations and expose you to common Agile-related PMP exam questions. Whether you’re new to Agile or seeking to strengthen your understanding, our scenario-based PMP Agile questions are valuable tools for effective concept comprehension.
| Name | Date | Place | – |
| PMP Certification and Training | 18 Apr – 17 May 2024 | Pune | More Details |
| PMP Certification and Training | 4 May – 2 June 2024 | Chennai | More Details |

Histogram As A Component Of Seven Basic Quality Tools In the Project Management Professional (PMP) ...
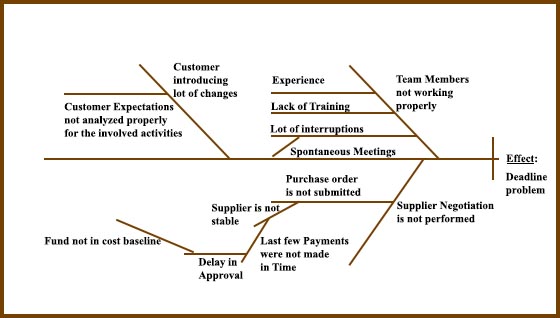
In the context of the PMP exam, a Cause-and-Effect Diagram, also known as an Ishikawa ...
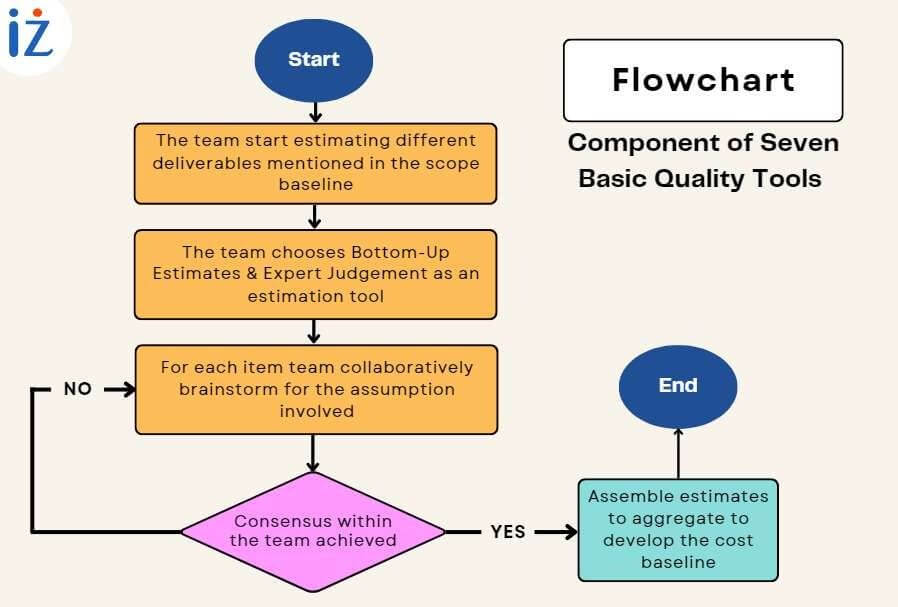
A flowchart, one of the seven basic quality tools, is defined as a graphical presentation ...
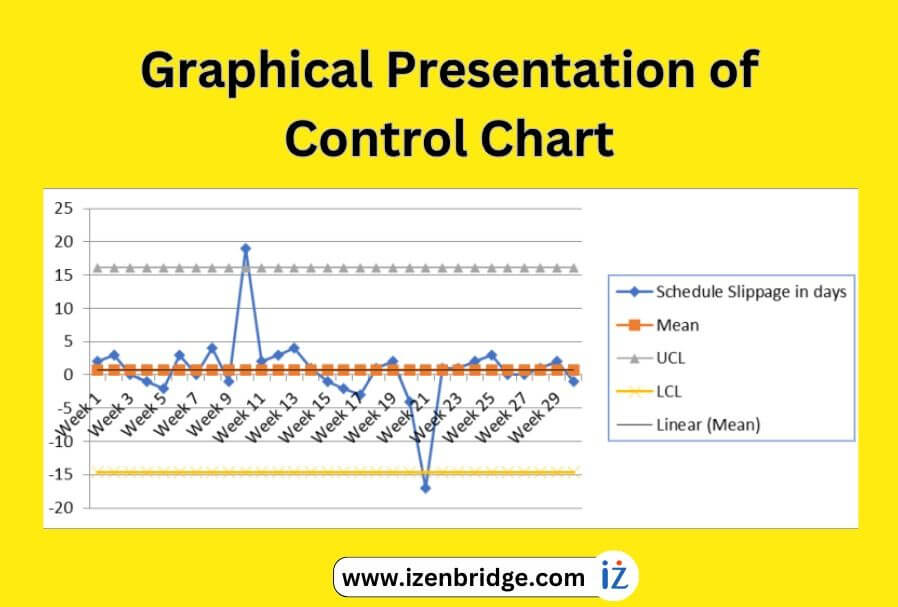
A control chart, a valuable quality tool in the PMP exam, helps us gain insights ...
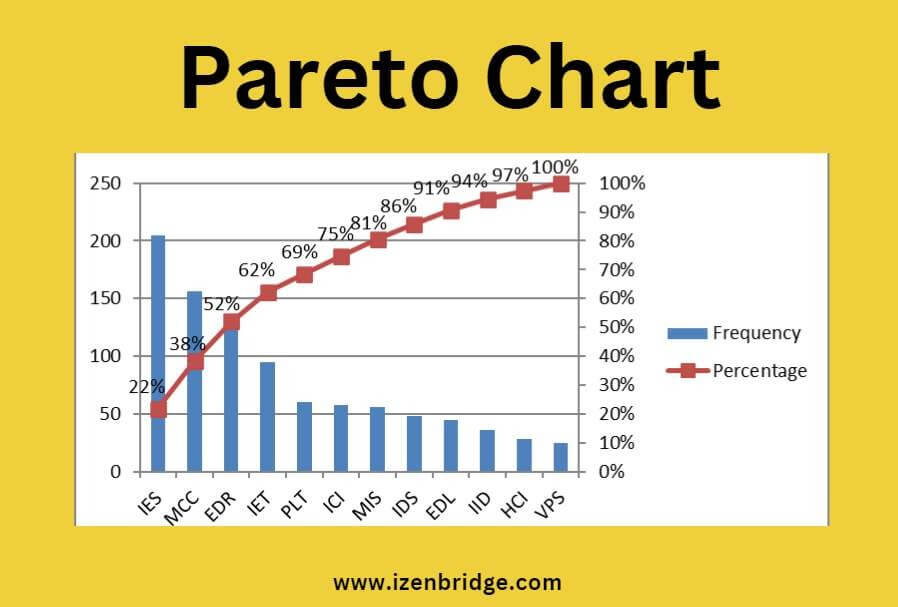
The Pareto Chart is a valuable technique in the PMP exam for identifying the most ...
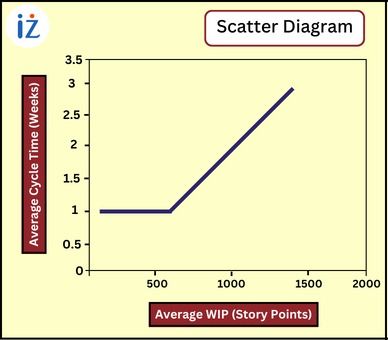
A scatter diagram in the PMP exam is a quality tool that aids project managers ...